Swing Trading Opportunities Open Up
A test pilot program for wider spreads focused on small cap stocks and was initiated by the Securities and Exchange Commission. It was to provide more liquidity for those stocks, and was a huge success becoming the standard for all small cap stocks.Following the nearly identical path, the Wilshire 5000 stocks also had test pilot program that was very similar to the small cap stock pilot test program. Both were FORWARD testing program using real time live market activity. This makes these test programs extremely reliable with a faster determination of whether or not the wider spreads help liquidity and short-term traders.
For Retail and Technical Traders these test programs offer more trading opportunities as the spreads are sufficiently wide enough to allow scalping for Day Traders, stronger runs for Swing Traders, and stronger Platform Formations for Position Traders.
However in order to take advantage of the wider spreads, Retail and Technical Traders need to learn the new Candlestick Patterns from Wider Spread Programs and Buy Entry Setups that now form. It has been over a decade since spreads were this wide on thousands of stocks with increased liquidity.
The wider spread program was initiated by the Securities and Exchange Commission after many giant and larger Buy Side Institutions requested a wider spread for small caps, and other stocks they intend to trade on a short-term basis. It will impact the Retail Trader anytime a major institution is actively trading millions of shares of stock for short-term profits Swing Trading, via their now larger number than ever before of trading floor Professional Traders.
It is imperative to use all the Worden Indicators that are designed to reveal larger lot activity over smaller lot activity. These help confirm that the price action is indeed a giant to larger institution that is Swing Trading a huge amount of stock.
In addition, Options Traders will need to be cautious about their interpretation of the Put/Call ratio. These large lot traders use Puts as insurance policies when they are short-term trading a huge number of shares. The cost of the Option Put to them is a small price to pay for mitigating risk. They use Option Puts instead of stop losses.
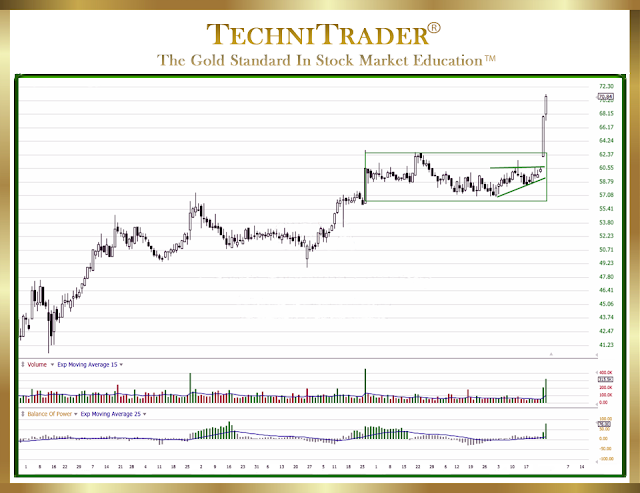
The chart below is a fine example of a small cap stock with 11 million outstanding shares, that has benefited from increased liquidity and more active short-term trading.
A compression pattern signaled Retail and Technical Traders of the conclusion of the Platform Formation sideways pattern, allowing for an early entry as the stock breaks to the upside. Worden Indicators all confirm large lot activity preceding the setup. This allowed Retail Traders to be in the stock before the High Frequency Trader action, riding up the nice solid gains for a day or two.
Summary
This new Candlestick Pattern from Wider Spread Programs provided a several point gain which is ideal for Swing Traders. Day Traders can also use this style of entry ahead of the High Frequency Trader runs and gaps. Since High Frequency Traders are the primary drivers of price, it is necessary to know how and when to enter before the High Frequency Trader run or gap.
TechniTrader has been educating Worden TC2000 Users for over 18 years. TechniTrader provides detailed training on how to use Worden TC2000 Indicators that are unique in revealing large lot activity, which is easily recognized once traders learn the new patterns. These new patterns form due to Market Structural changes, such as the wider spread programs. Watch a wide variety of Webinars at TechniTrader.com here:
Trade
Wisely,
Martha Stokes CMT
TechniTrader technical analysis using TC2000 charts, courtesy of Worden Bros.
Martha Stokes CMT
TechniTrader technical analysis using TC2000 charts, courtesy of Worden Bros.
Chartered Market Technician
Instructor & Developer of TechniTrader Stock and Option Courses
TechniTrader DVDs with every course.
©2016–2024 Decisions Unlimited, Inc. dba TechniTrader. All rights reserved.
TechniTrader is also a registered trademark of Decisions Unlimited, Inc.
Disclaimer: All statements are the opinions of TechniTrader, its instructors and/or employees, and are not to be construed as anything more than an opinion. TechniTrader is not a broker or an investment advisor; it is strictly an educational service. There is risk in trading financial assets and derivatives. Due diligence is required for any investment. It should not be assumed that the methods or techniques presented cannot result in losses. Examples presented are for educational purposes only.


